Cotton and Wool Outlook: September 2026

Leslie Meyer and Taylor Dew
Global Cotton Mill Use Projected To Rise for Fourth Consecutive Year in 2026/27
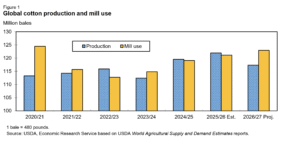
The latest U.S. Department of Agriculture (USDA) cotton projections for 2026/27 (August–July) indicate that global mill use is forecast to increase 1.8 million bales (1.5 percent) from the previous year to 122.9 million bales, the highest in 6 years (figure 1). All major spinning countries’ mill use is projected to increase or remain unchanged in 2026/27, led by India and China. The largest user of raw cotton— China—accounts for 34 percent of the global total in 2026/27. World cotton production is expected to decrease 4.6 million bales (4 percent) from the previous year to 117.3 million bales in 2026/27. Production for each major producing country is projected to decline except for India which is forecast to increase slightly. World cotton stocks are expected to decline nearly 5.5 million bales (7 percent) as the largest difference between mill use and production is forecast since 2020/21. Global cotton trade in 2026/27 is expected to decline slightly from the previous year, with Brazil and the United States continuing as the primary exporters while Vietnam and Bangladesh are forecast as the leading importers.
Domestic Outlook
U.S. Cotton Crop Forecast Reduced in September
USDA’s September Crop Production report forecasts 2026/27 U.S. cotton production at 13.2 million bales, 3 percent (400,000 bales) below the August estimate and 5 percent (700,000 bales) below the 2025/26 crop. Lower yields in the Southwest region accounted for much of the September crop reduction, with mostly offsetting yield adjustments occurring elsewhere. The 2026/27 U.S. cotton crop is forecast at the second lowest level since 2015/16. (See table 10 associated with this report for current production estimates by State.) U.S. cotton planted and harvested area for 2026/27 were both revised marginally lower in September. Planted acreage is estimated at 10.45 million acres by USDA’s National Agricultural Statistics Service (NASS), while harvested area is projected at nearly 8.2 million acres. U.S. 2026/27 abandonment is expected to approach 22 percent compared with last season’s 15.6 percent. The 2026/27 national yield is forecast to be lower at 776 pounds per harvested acre compared with 852 pounds last season. This season’s yield is also projected below the 3-year average of 881 pounds as more than half of the harvested acreage is once again expected to be from lower-yielding areas. Upland cotton production in 2026/27 is forecast at 12.8 million bales, 5 percent (683,000 bales) below 2025/26 and nearly 1.3 million bales below the 5-year average. Compared with last season, 2026/27 U.S. upland production is expected to decline largely in the Southwest, with gains forecast for the Southeast and Delta regions (figure 2)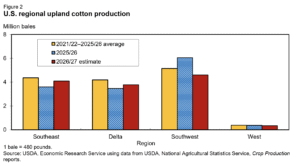
In the Southwest, 2026/27 upland cotton production is forecast at 4.6 million bales, 24 percent below a year ago but above the drought-reduced production levels of the previous 3 years. For 2026/27, Southwest upland cotton planted area is estimated higher at 6.5 million acres while harvested acreage is projected lower than the previous year at 4.3 million acres. Consequently, a 2026/27 abandonment rate of about 34 percent is forecast in September, compared with approximately 23.5 percent during the previous season. Meanwhile, the Southwest yield is forecast at 514 pounds per harvested acre in 2026/27, well below the 5-year average and the lowest yield since 2003/04. The region’s upland crop is expected to contribute 36 percent of U.S. production in 2026/27, similar to the 5-year average.
Upland cotton production in the Southeast in 2026/27 is projected to reach 4.1 million bales, up nearly 14 percent from a year earlier as increased area more than offsets a reduction in yield. The Southeast harvested area is forecast at 2.1 million acres in 2026/27 while the region’s yield is expected to decline from 2025/26’s near-record yield of 1,026 pounds per harvested acre to 942 pounds. The 2026/27 Southeast crop is forecast to account for 32 percent of U.S. upland production, slightly above the 5-year average.
The 2026/27 Delta cotton crop is forecast at 3.8 million bales, 9 percent above 2025/26 due to an area and yield rebound. Harvested area is projected at 1.5 million acres while the region’s yield is estimated at 1,198 pounds per harvested acre, similar to the previous 3-year average. The Delta is expected to produce nearly 30 percent of the U.S. upland crop this season, similar to the 5-year average.
In the West, 2026/27 upland cotton production is projected at 339,000 bales, the second lowest in nine decades (ahead of only 2023/24’s 285,000 bales). Near average area, combined with a below average yield of 1,245 pounds per harvested acre, are forecast for the region this season. Upland output in 2026/27 is projected to account for less than 3 percent of the U.S. total. Extralong staple (ELS) cotton—primarily grown in the West—is forecast at 392,000 bales in 2026/27, the lowest in 3 years. ELS harvested area is expected at approximately 137,000 acres while the yield is estimated at 1,376 pounds per harvested acre this season, both below a year ago.
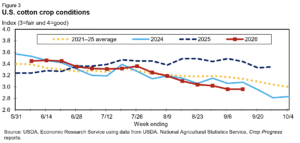
U.S. cotton crop development by mid-September was running ahead of both last season and the 5-year average. As of September 13, 57 percent of the cotton area had bolls opening, compared with 49 percent last season and 48 percent for the 2021–25 average. Texas and Georgia—the States with the largest area—each had bolls opening on 55 percent of their respective acreage in 2026. U.S. cotton crop conditions in 2026 continue below the previous 2 years and the 2021–25 average (figure 3). As of September 13, 36 percent of the cotton area was rated “good” or “excellent,” compared with 52 percent last year, while 34 percent was rated “poor” or “very poor,” compared with 14 percent a year earlier. Meanwhile, cotton harvest has started in a number of States, with the U.S. average harvested at 8 percent as of September 13.( Figure 3)
U.S. Cotton Demand and Stock Estimates Lowered in September
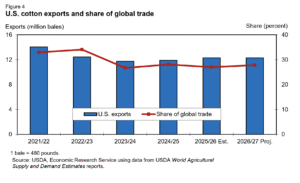
The estimate for U.S. cotton demand (mill use plus exports) for 2026/27 is projected at 13.8 million bales, with U.S. exports contributing the bulk of the total. U.S. cotton exports are projected at 12.3 million bales in 2026/27, unchanged from last month and the previous year as global trade competition from Brazil is expected to continue. With world trade prospects forecast slightly lower in 2026/27, the U.S. share of global trade is projected marginally higher. For 2026/27, the U.S. share is forecast at about 28 percent, slightly above last season and the 3year average (figure 4). U.S. cotton mill use is projected at 1.5 million bales in 2026/27, below last month’s forecast but equal to last season’s final estimate.
 Based on the latest supply and demand estimates, the U.S. ending stocks estimate for 2026/27 is projected at 3.6 million bales, 10 percent lower than forecast in August and 550,000 bales (13 percent) lower than the 2025/26 level. The U.S. stocks-to-use ratio is expected to be 26 percent at the end of the season, compared with 30 percent for 2025/26. With fewer supplies, a lower stocks-to-use ratio, and the current global outlook, the 2026/27 average farm price is expected to rise this season. The 2026/27 upland cotton farm price is forecast at 78 cents per pound, 16 cents above the 2025/26 estimate. The final 2025/26 upland farm price estimate will be released by USDA, NASS at the end of September.
International Outlook
Global 2026/27 Cotton Production Forecast Lower
Global cotton production in 2026/27 is projected at 117.3 million bales, 4 percent (4.6 million bales) below the previous year. For 2026/27, cotton production prospects for most of the majorproducing countries are projected to decline except for India. The global decrease is primarily the result of reductions this season for China and Australia. Smaller declines for the United States, Pakistan, and Brazil also contributed to the lower world production. India is the only major country projected to increase its production in 2026/27. World harvested area in 2026/27 is forecast at 29.7 million hectares (73.3 million acres), basically unchanged from the previous year. The 2026/27 global cotton yield is forecast at 861 kilograms (kg) per hectare (768 pounds per acre), down 33 kg per hectare from the record high in 2025/26 but still 4 percent above the 5-year average.
World cotton production remains concentrated among a few countries, with the top four countries (China, India, Brazil, and the United States) accounting for 76 percent of total expected production in 2026/27, up slightly from the previous season. China and India are expected to continue as the leading cotton producers in 2026/27, accounting for 29 percent and 20 percent, respectively, of the global total (figure 5).
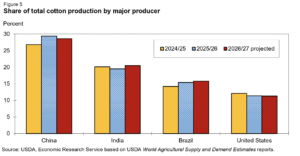
China is projected to produce 33.5 million bales of cotton, down 6 percent (2.3 million bales) from 2025/26. China’s harvested area is expected to decrease slightly (1.5 percent) in 2026/27 to 3.0 million hectares. China’s yield is also forecast to decline from last year’s record (2,556 kg per hectare) to 2,431 kg per hectare, primarily from less-than-ideal growing conditions this season. Production in India is forecast at 24.0 million bales in 2026/27, 1 percent (200,000 bales) above last season. India’s increase in yield more than offsets the slight decline in harvested area in 2026/27. Harvested area in India is forecast 25,000 hectares lower at 11.5 million hectares while yield is projected 4 kg per hectare higher at 454 kg per hectare this season.
Brazil’s production is estimated to decline for the first time since 2022/23 as a decrease in harvested area more than offsets the increase in yield. Production in Brazil in 2026/27 is forecast to decline 1 percent (250,000 bales) to 18.5 million bales, slightly below last season’s record but still the second highest on record. Brazil’s yield is forecast to increase to a record 2,014 kg per hectare this season.
In 2026/27, the U.S. cotton crop is projected to decline as a lower yield more than offsets increased area. Cotton production in Pakistan is expected to decline nearly 6 percent (300,000 bales) to 5.0 million bales. Harvested area in Pakistan is expected to decline 5 percent (100,000 hectares) to 1.9 million hectares. Yield is also expected to decline slightly to 573 kg per hectare, 4 kg per hectare below 2025/26. Australia’s cotton production is expected to decrease by onethird (1.5 million bales) to 3.0 million bales, the result of lower reservoir levels that are forecast to reduce area for the upcoming season. Australia’s harvested area in 2026/27 is expected to decline 31 percent (145,000 hectares) to 325,000 hectares, while yield is forecast to decline 75 kg per hectare to 2,010 kg per hectare.
Global Cotton Mill Use Projected Higher in 2026/27
World cotton mill use in 2026/27 is forecast at 122.9 million bales, 1.8 million (1.5 percent) above 2025/26 and the highest since 2020/21 when global mill use reached a record 124.5 million bales. Steady world economic growth projections and higher polyester prices are expected to support global cotton mill use in 2026/27.
For the top six cotton-spinning countries—China, India, Pakistan, Vietnam, Bangladesh, and Turkey—mill use is projected to account for a combined 82 percent of the world total in 2026/27, unchanged from last year. Cotton mill use in 2026/27 is forecast to increase for all major spinning countries except for Turkey which remains unchanged. For China, mill use is forecast at 42.0 million bales in 2026/27, 400,000 bales above the previous year. China remains the leading cotton spinner globally, accounting for more than one-third of world cotton mill use (figure 6).
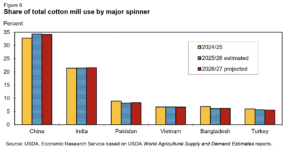
Mill use in India is projected at 26.5 million bales for 2026/27, up 2 percent (500,000 bales) from the year before. India remains the second-largest spinner in 2026/27 and is expected to account for 22 percent of the world mill use total, up slightly from last year. For Pakistan, 2026/27 cotton mill use is expected to contribute 8 percent (10.2 million bales) of the global total, an increase of 3 percent from last year. Similarly, mill use in Bangladesh is forecast to expand nearly 3 percent (200,000 bales) to 7.6 million bales in 2026/27. Mill use in Vietnam is forecast to increase slightly to 8.2 million bales, while Turkey is to remain unchanged at 6.8 million bales.
World 2026/27 Cotton Trade and Stocks Forecast Lower
Global cotton trade is forecast lower at 44.2 million bales in 2026/27. Despite reduced 2026/27 cotton crop forecasts for the United States and Brazil, exports for the top suppliers to the world are projected to remain unchanged from the previous year while exports for Australia are expected to be limited by their crop reduction. Brazil is forecast to export 15.5 million bales of cotton this season, matching 2025/26’s record, and account for 35 percent of the world total in 2026/27. In comparison, U.S. cotton exports in 2026/27 are forecast at 12.3 million bales, or 28 percent of the global total. Australia’s 2026/27 cotton exports are expected to decline 1.1 million bales (19.5 percent) from a year ago to 4.5 million bales due to its reduced crop prospects.
Among the major importers, reduced global imports by India and China are somewhat offset by gains elsewhere. Cotton imports by India vary from year to year and are projected at 3.0 million bales in 2026/27, down from 5.1 million bales last season but similar to the 2024/25 level. India’s reduced 2026/27 import demand results from a slightly larger crop forecast and the highest beginning stock level in 5 years. Cotton imports by China are forecast at 7.0 million bales in 2026/27, 250,000 bales below the year before. China’s ongoing national reserve auctions that began earlier this summer appear to diminish the need for imported cotton in 2026/27. On the other hand, imports by Vietnam—forecast to be the largest cotton importer in 2026/27—are projected at 8.2 million bales in support of its expanding textile industry. Bangladesh’s cotton imports are forecast at 7.4 million bales, up 200,000 bales from 2025/26, while Pakistan’s imports are forecast 700,000 bales higher in 2026/27 at 5.1 million bales.
Based on the latest cotton supply and demand estimates, global cotton ending stocks for 2026/27 are forecast at 69.9 million bales, 7 percent below last season and the lowest level in 15 years. Stock declines are forecast for all of the major producers in 2026/27, with the largest stock reduction (down 1.6 million bales) expected in China. For China, the largest stockholder, ending stocks are projected at about 34.7 million bales, accounting for nearly half of the global total in 2026/27. India is expected to hold an additional 15 percent of this season’s total or 10.3 million bales. In addition, lower stock projections are forecast for the United States, Brazil, and Australia, where stocks are projected at 3.6 million bales, 3.2 million bales, and 2.5 million bales, respectively. With the lowest level of world cotton ending stocks since 2011/12 and the lowest stocks-to-use ratio since 2010/11, higher global cotton prices are projected for 2026/27.
Highlight
The U.S. Cotton Ending Stocks Calculation for 2025/26
U.S. cotton supply, demand, and stocks estimates are updated monthly in USDA’s World Agricultural Supply and Demand Estimates (WASDE) report. During most of the marketing year, the ending stocks estimate is a function of the cotton supply estimate for the season minus the cotton demand estimate. In addition, in most months a nominal quantity is added or subtracted to allow ending stocks to round to the nearest 100,000 bales. However, once the season has ended, USDA’s cotton Interagency Commodity Estimates Committee (ICEC) is tasked with finalizing ending stocks based on actual stock surveys and other relevant data. T
able A shows the components used to calculate 2025/26 and 2024/25 U.S. cotton ending stocks. Adjustments were made to reflect the lag between the report dates and the end of the marketing year on July 31. In addition, the calculation includes a deduction for any reported new crop cotton ginnings prior to the end of the marketing year to prevent double counting production in the subsequent season’s supplies.
Since the development of the USDA, NASS survey in 2015, reports exist for all stock categories except for stocks in transit and at ports. This category is estimated by the cotton ICEC. Historically, the source utilized to calculate in-transit stocks was USDA, Foreign Agricultural Service (FAS) Export Sales shipment data. However, a review of the in-transit data implications during the 2023/24 methodology adjustment for calculating marketing year cotton exports indicated the need for higher in-transit stocks than previously estimated.
The ending stocks calculations shown in table A incorporate estimates for in-transit stocks based on data from USDA, Agricultural Marketing Service (AMS) Bales Made Available for Shipment (BMAS) report instead of the USDA, FAS Export Sales report. In addition, the conversion factor (1.025) from running bales to statistical 480-pound bales used in the computation closely matches the weights reported in the USDA, NASS Cotton Ginnings annual summary report.
Based on the available data, U.S. cotton stocks on July 31, 2026—the end of the 2025/26 marketing year—are computed to be approximately 4.0 million running bales or 4.15 million statistical (480-pound) bales. The 2025/26 U.S. ending stocks estimate is 150,000 bales (4 percent) above the 2024/25 estimate of 4.0 million bales, and the stocks-to-use ratio is marginally higher at 30 percent. In addition, the 2025/26 stocks and stocks-to-use ratio are slightly above their respective 3-year averages.